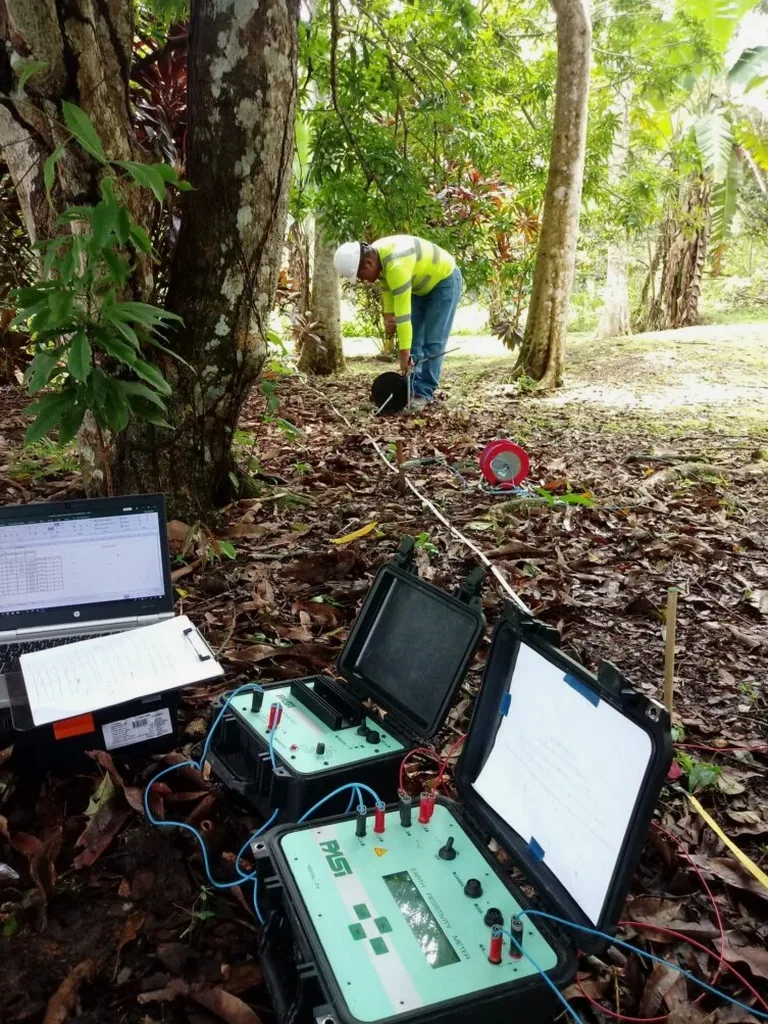
A four-electrode array stretches across a stubble field on the outskirts of Carlow town, the terrameter cycling through its current injections while the operator logs apparent resistivity values. The equipment itself is unassuming—a ruggedized console, stainless steel stakes, and insulated cable reels—but the vertical electrical sounding it performs can distinguish water-bearing gravels from compact glacial till at thirty metres depth without turning a single shovelful of soil. Carlow sits on a buried bedrock surface of Carboniferous limestone draped by variable drift deposits, and the resistivity contrast between saturated sands, dry boulder clay, and karstified rock makes the method particularly diagnostic here. We run both Wenner and Schlumberger arrays depending on target resolution, feeding field data through RES2DINV for inversion modelling. In practice, most Carlow projects that reach us need VES to answer a single practical question: where is solid rock, and is it competent enough to bear without deep excavations becoming a cost overrun.
Resistivity data doesn’t lie, but it does need a geologist who knows the difference between Carlow’s waterlogged till and its dry limestone pinnacles.
Methodology applied in Carlow
Local geotechnical conditions in Carlow
The mistake we see repeated on Carlow sites is treating resistivity as a standalone ‘depth-to-rock’ tool without calibrating it against at least one borehole or trial pit. Glacial till in this part of the Irish Midlands can be clay-rich and conductive, mimicking weathered shale or water-filled fractures, so a low-resistivity zone at twelve metres might be interpreted as bedrock when it’s actually a dense lodgement till sitting on a dry gravel—and that misread changes the entire foundation design. The fix isn’t complicated: we always recommend a single SPT drilling point collocated with a VES centre so that the resistivity layers are tied to actual N-values and lithology. Once that calibration exists, the rest of the resistivity lines become quantitatively useful rather than just suggestive. On brownfield sites with possible hydrocarbon or leachate contamination, the risk flips: resistivity lows that look like clay may be conductive plumes, and without a test pit or chemical sampling, the geophysical interpretation remains ambiguous and potentially misleading to the environmental consultant.
Our services
Every resistivity survey we run in Carlow starts with a desk study of the GSI Quaternary and bedrock maps, because knowing whether we’re on the Ballyadams Formation limestone or the Tullow pluton granite changes the expected resistivity baseline. The three service packages below cover the most common local requests.
Depth-to-Bedrock VES
Targeted vertical electrical soundings for foundation design and road cuttings. We expand AB/2 spacing progressively until the bedrock resistivity asymptote is clear, then correlate with available borehole data to produce a contoured rockhead surface.
Groundwater & Aquifer Mapping
Resistivity traverses across the Barrow gravels and buried esker deposits to delineate productive water-bearing units. Combined with 1D inversions, this helps well drillers position boreholes where saturated thickness is greatest.
Brownfield & Plume Delineation
Resistivity and induced polarization on former industrial plots in Carlow town. Conductive leachate plumes and hydrocarbon-impacted zones show characteristic signatures that guide subsequent intrusive sampling.
Questions and answers
How much does an electrical resistivity survey cost for a typical Carlow site?
For a single-family dwelling or small commercial plot in the Carlow area, a VES campaign with four to six soundings and a 2D traverse typically falls between €540 and €1,040. The spread depends on line length, number of VES centres, and whether we need to deploy a dipole-dipole configuration for high-contact-resistance ground. We provide a written quote after reviewing the site location and the GSI bedrock map.
Can resistivity tell the difference between limestone and granite bedrock in County Carlow?
Yes, and the contrast is often strong. Fresh granite on the east side of the county typically reads above 1,000 ohm-m, while the Carboniferous limestone around Carlow town and the Barrow valley usually falls in the 200–800 ohm-m range, with lower values where karstification and water-filled fissures are present. The weathered transition zone above each rock type also has a distinct resistivity gradient, so with proper inversion we can map the weathering profile thickness, which is critical for piling refusal estimates.
What is the difference between a VES and a 2D resistivity imaging line?
A vertical electrical sounding (VES) keeps the electrode array centred at one point and progressively increases the electrode spacing to build a 1D model of resistivity versus depth. It’s fast and ideal for depth-to-bedrock questions. A 2D imaging line uses multiple electrodes along a cable with automatic switching to produce a cross-section showing both lateral and vertical resistivity changes. On Carlow sites we usually run a 2D traverse first to spot lateral anomalies, then drop VES centres at key positions for the detailed depth profile.